Before the Pod Starts: GPU Node Setup for LLMs on Kubernetes
Series links
A pod is usually where Kubernetes conversations start. You write a Deployment, set requests and limits, pick a container image, add a Service, and let the scheduler place the workload somewhere in the cluster.
That is fine for normal applications. It is not enough for LLM serving.
Part 3 explained why a large model does not simply "run in a pod." A serving replica may be a coordinated GPU group. It may span multiple GPUs. It may depend on tensor parallelism, pipeline parallelism, expert parallelism, NCCL communication, model server behavior, and the shape of the hardware underneath it.
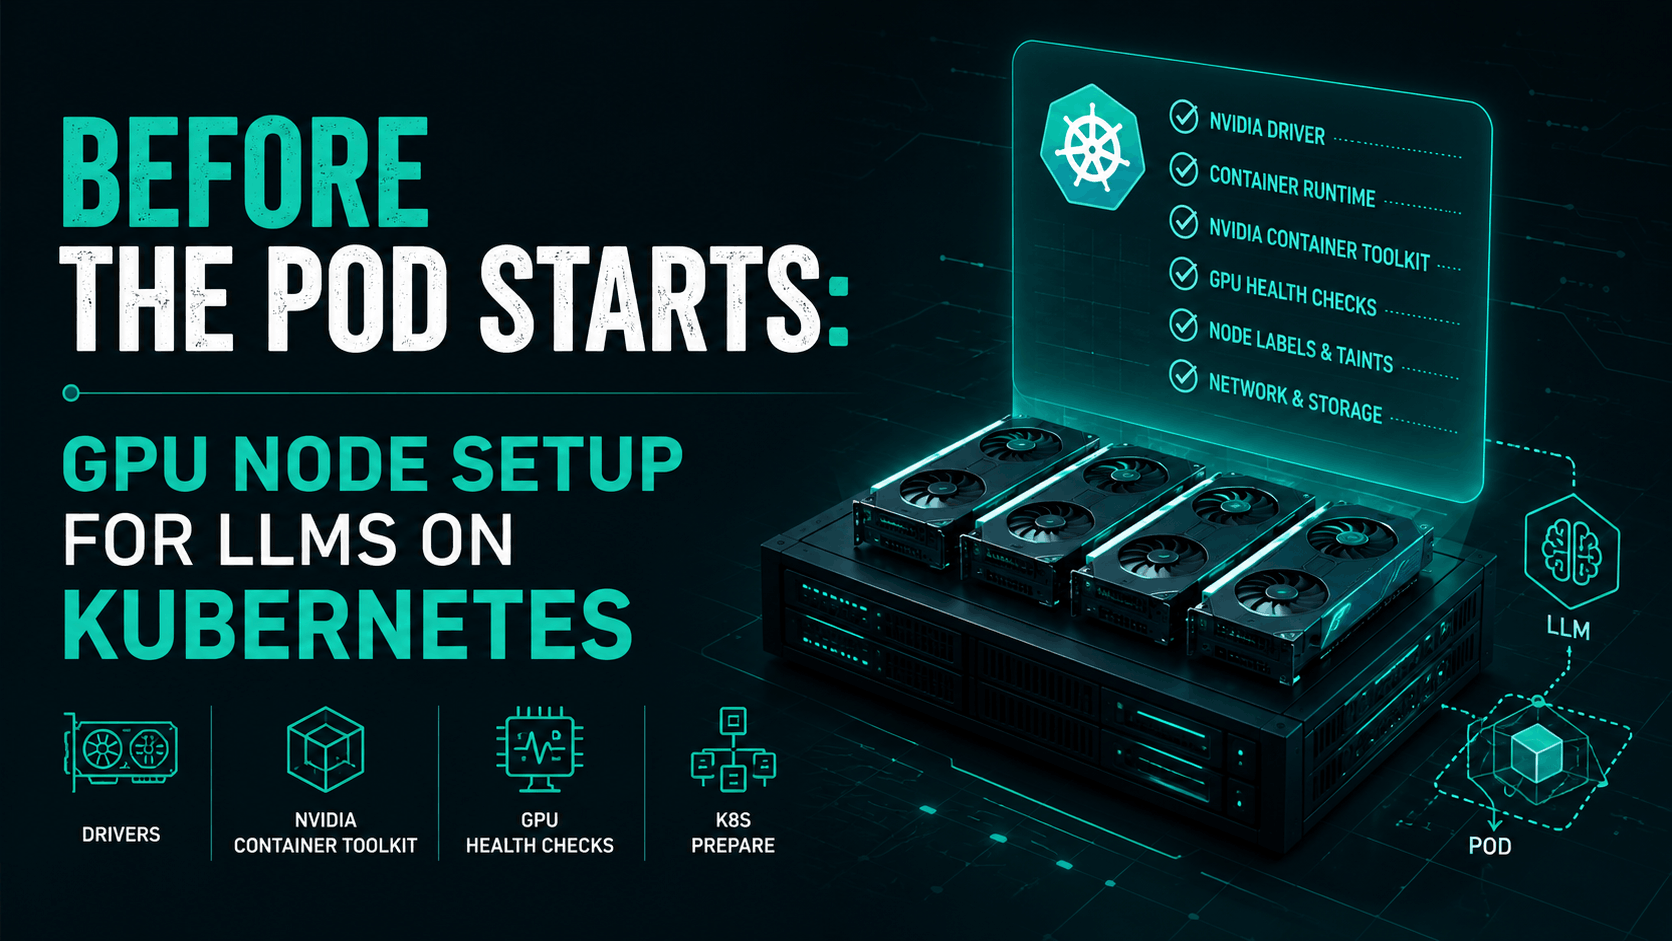
Part 4 moves one layer down: before the pod starts, the GPU node has to be prepared correctly. Kubernetes has to know that a node has GPUs. The container runtime has to expose those GPUs into containers. The node needs the right driver stack. The device plugin has to advertise schedulable resources. Labels have to describe what kind of GPU capacity exists. Metrics have to tell you whether the GPUs are healthy and useful. If you use MIG, time-slicing, or MPS, the sharing model has to be explicit.
Otherwise Kubernetes is scheduling blind.
It may see a node. It may even see nvidia.com/gpu. But that still does not mean the node is ready to serve LLM traffic well.
A GPU node is not just a bigger worker node
A normal Kubernetes worker node needs a kubelet, a container runtime, networking, storage integration, and enough CPU and memory to run pods. A GPU node needs all of that, plus a second hardware and software stack that has to line up cleanly.
At minimum, you care about:
- the GPU model and memory size
- the NVIDIA driver
- CUDA compatibility
- the NVIDIA Container Toolkit
- the Kubernetes device plugin
- GPU feature labels
- monitoring through DCGM
- node pool isolation
- taints and tolerations
- runtime behavior for MIG, MPS, or time-slicing
- whether the node can support the serving engine you plan to run
This is why "add GPU nodes" is a dangerous oversimplification. A node with a T4, a node with an A10, a node with an A100 split into MIG instances, and a node with H100s connected through NVLink are all very different scheduling targets.
For a small model, that difference may only affect throughput. For a large model, it may decide whether the deployment works at all.
A Kubernetes scheduler does not automatically understand all of those details. It schedules based on resources, constraints, labels, taints, affinity rules, and plugins. If the GPU node does not publish the right information, Kubernetes cannot make a good placement decision.
What Kubernetes actually sees
Kubernetes has a generic way to work with special hardware through the device plugin framework. The kubelet does not magically discover every accelerator and understand how to allocate it. A vendor or third-party device plugin registers with the kubelet and advertises device resources to the node.
For NVIDIA GPUs, the common resource name is:
nvidia.com/gpu
Once the device plugin is running, a pod can request that extended resource with a quantity:
resources:
  limits:
    nvidia.com/gpu: 1
That is the basic Kubernetes contract. The pod asks for one GPU. The node says it has allocatable GPU resources. The scheduler only places the pod on a node that can satisfy the request.
Useful, but limited.
That resource request hides most of the information LLM platforms actually need. The GPU might have 16 GB, 80 GB, or 192 GB of memory. The node may or may not have NVLink between GPUs. The GPU might be in MIG mode. The node might belong to an inference pool, a training pool, a batch pool, or somebody's experiment corner. DCGM may already be reporting errors. The model server may need a topology this node cannot provide.
The device plugin makes GPUs schedulable. It does not make Kubernetes an LLM placement brain.
That distinction matters. A lot of LLM failures start when teams treat nvidia.com/gpu: 1 as the whole story.
The NVIDIA GPU Operator is the usual starting point
You can install every GPU component manually, but most production Kubernetes setups use the NVIDIA GPU Operator or a cloud provider equivalent. The operator exists because a GPU node needs more than one daemon.
NVIDIA describes the problem plainly: Kubernetes can provide access to special hardware through device plugins, but configuring nodes also requires drivers, container runtimes, libraries, monitoring, and other components. The GPU Operator automates much of that node-level software stack.
In practice, the operator can manage or deploy components such as:
- NVIDIA drivers, if you want the operator to manage them
- NVIDIA Container Toolkit
- NVIDIA Kubernetes device plugin
- GPU Feature Discovery
- DCGM and DCGM Exporter
- MIG Manager
- validator pods
The exact setup depends on your environment. Managed Kubernetes providers sometimes preinstall drivers or handle parts of the stack. Bare metal clusters may need the operator to do more. Air-gapped clusters need image mirroring and version discipline. Some organizations deliberately manage drivers outside the cluster because kernel and driver upgrades are part of their node image pipeline.
A basic install usually starts with Helm:
helm repo add nvidia https://helm.ngc.nvidia.com/nvidia
helm repo update

kubectl create namespace gpu-operator
If your cluster enforces Pod Security Admission, label that namespace before the operator starts creating privileged node-level components:
kubectl label --overwrite ns gpu-operator \
  pod-security.kubernetes.io/enforce=privileged
Then install the operator:
helm install gpu-operator nvidia/gpu-operator \
  -n gpu-operator \
  --version=v26.3.2 \
  --wait
Then check that the operator-managed pods are actually running:
kubectl get pods -n gpu-operator
kubectl get daemonset -n gpu-operator
The exact pod names vary by GPU Operator version and configuration, but this is the point where you should see components for the device plugin, GPU Feature Discovery, DCGM Exporter, validators, and any driver/toolkit pieces your environment needs.
The important point is not "always install the operator and forget everything else." The point is: there is a GPU node stack, and something has to own it.
If nobody owns it, the first real LLM workload becomes the integration test.
That is a bad place to learn that the driver, CUDA userspace, container runtime, and model server image do not agree with each other.
The device plugin turns GPUs into schedulable resources
The NVIDIA device plugin is the bridge between the physical GPUs on the node and the resources Kubernetes can schedule. It runs on GPU nodes, discovers the devices, registers them with the kubelet, and exposes resources such as nvidia.com/gpu.
This is the part many platform engineers recognize first because it shows up directly in pod specs.
A minimal workload might request one GPU like this:
apiVersion: v1
kind: Pod
metadata:
  name: llm-worker
spec:
  containers:
    - name: worker
      image: example/llm-server:latest
      resources:
        limits:
          nvidia.com/gpu: 1
After the device plugin is running, verify what the node advertises:
kubectl describe node <gpu-node-name> | grep -A6 -E "Capacity|Allocatable"
On a node with one physical GPU and no sharing enabled, you might see:
Capacity:
  cpu:                32
  memory:             131932000Ki
  nvidia.com/gpu:     1

Allocatable:
  cpu:                32
  memory:             131829600Ki
  nvidia.com/gpu:     1
On a node with four physical GPUs, the same resource name may show a capacity of 4. Without MIG or time-slicing, that number usually maps to physical GPU count. With time-slicing, it can become logical shared capacity instead. That difference matters.
You should also run a small GPU smoke test before trusting the node for model serving:
apiVersion: v1
kind: Pod
metadata:
  name: cuda-vectoradd
spec:
  restartPolicy: OnFailure
  containers:
    - name: cuda-vectoradd
      image: nvcr.io/nvidia/k8s/cuda-sample:vectoradd-cuda12.5.0-ubuntu22.04
      resources:
        limits:
          nvidia.com/gpu: 1
Then apply it and check the logs:
kubectl apply -f cuda-vectoradd.yaml
kubectl logs pod/cuda-vectoradd
That proves two things: Kubernetes can schedule a pod that requests a GPU, and the container can actually use the GPU runtime path. It still does not prove that the node is good for a large LLM.
That YAML is useful, but it is only the outermost layer. For a serious LLM workload, you usually need to ask more questions:
- Which GPU model should this pod land on?
- How much GPU memory does the model need?
- Is this a full GPU, a MIG slice, or a time-sliced replica?
- Can the serving engine use this GPU type efficiently?
- Does this workload need multiple GPUs on the same node?
- Does it need a specific driver or CUDA capability?
- Should it avoid nodes shared with batch or notebook workloads?
The scheduler can only respect these requirements if you express them through resources, labels, affinity, taints, topology constraints, or a higher-level scheduler. If the cluster only exposes a flat nvidia.com/gpu resource, you have thrown away a lot of useful placement information.
For simple inference, that may be acceptable. For large LLM serving, it usually is not.
Labels are how the node starts telling the truth
Kubernetes scheduling improves when nodes describe themselves. That is where Node Feature Discovery and GPU Feature Discovery come in.
Node Feature Discovery detects hardware features available on each node and advertises them through node labels, and optionally extended resources, annotations, and taints. It is not GPU-specific. It can label CPU features, kernel features, PCI devices, and other node capabilities.
GPU Feature Discovery is NVIDIA-specific. It labels GPU properties so workloads and schedulers can distinguish between different GPU nodes. Historically it existed as its own project, and NVIDIA has since archived the standalone repository, but the function remains part of the GPU Operator stack.
The labels are the difference between "this node has a GPU" and "this node has the kind of GPU I want."
You might care about labels for:
- GPU product name
- GPU count
- GPU memory
- CUDA driver capability
- MIG capability
- MIG strategy
- GPU family or architecture
- whether a node belongs to a production inference pool
- whether a node is allowed to run experimental workloads
The exact label names vary by component and version, so do not hard-code examples from a blog post into production without checking your cluster. The pattern is what matters:
nodeSelector:
  accelerator: nvidia-h100
or:
affinity:
  nodeAffinity:
    requiredDuringSchedulingIgnoredDuringExecution:
      nodeSelectorTerms:
        - matchExpressions:
            - key: nvidia.com/gpu.product
              operator: In
              values:
                - NVIDIA-H100-80GB-HBM3
That is the practical scheduling jump. You stop saying "give me a GPU" and start saying "give me this class of GPU node."
LLM serving needs that distinction because GPU memory, interconnect, and serving-engine support shape the deployment. A 7B model, a 70B model, and a multi-GPU serving group should not all be treated as generic GPU workloads.
Taints and tolerations keep GPU nodes from becoming expensive junk drawers
GPU nodes are too expensive to become general worker nodes by accident.
A common pattern is to taint GPU nodes so normal pods do not land there unless they explicitly tolerate the taint:
kubectl taint nodes gpu-node-1 accelerator=nvidia:NoSchedule
Then GPU workloads add a toleration:
tolerations:
  - key: "accelerator"
    operator: "Equal"
    value: "nvidia"
    effect: "NoSchedule"
That looks basic, but it matters. Without isolation, GPU nodes can become a dumping ground for random sidecars, CPU-heavy services, log agents with bad limits, notebooks, experiments, and batch jobs that make production inference harder to reason about.
For LLMs, you may need more than one GPU pool:
- production online inference
- batch inference
- experiments and notebooks
- fine-tuning or training
- small-model serving
- large-model serving
- MIG-backed shared inference
- full-GPU serving
These pools may use the same Kubernetes cluster but should not have the same scheduling policy. Taints, labels, node selectors, priority classes, quotas, and admission policy are the boring controls that keep the expensive hardware usable.
This is also where platform teams start turning hardware into a product surface. Developers should not need to know every node name. They should be able to ask for a workload class, such as "small shared GPU inference" or "full H100 production inference," and let the platform map that to the right node pool.
DCGM is how you know whether the GPU is healthy and busy
Scheduling is only half the story. Once workloads land on GPU nodes, you need to know whether the GPUs are actually working well.
That is where DCGM and DCGM Exporter enter the setup. DCGM provides GPU telemetry. DCGM Exporter exposes metrics that can be scraped by Prometheus and visualized in Grafana or another observability stack.
If DCGM Exporter is enabled through the GPU Operator, it is usually part of the operator-managed stack. NVIDIA's chart exposes dcgmExporter.enabled, and the default is true. So first check whether it is already there before installing anything separately:
kubectl get pods -n gpu-operator | grep -i dcgm
kubectl get svc -n gpu-operator | grep -i dcgm
If your platform disables that component, or if you are not using the GPU Operator, then deploy DCGM Exporter separately through your observability stack instead of assuming GPU metrics will appear automatically.
For LLM serving, useful DCGM metrics include:
DCGM_FI_DEV_GPU_UTIL: GPU compute utilizationDCGM_FI_DEV_MEM_COPY_UTIL: memory copy utilizationDCGM_FI_DEV_FB_USED: framebuffer memory usedDCGM_FI_DEV_FB_FREE: framebuffer memory freeDCGM_FI_DEV_GPU_TEMP: GPU temperatureDCGM_FI_DEV_POWER_USAGE: power usageDCGM_FI_DEV_XID_ERRORS: XID error countDCGM_FI_DEV_ECC_DBE_VOL_TOTAL: volatile double-bit ECC errors
Those map directly to practical questions:
- Is the model filling GPU memory before traffic even arrives?
- Is KV cache pressure eating the remaining memory during generation?
- Is the GPU busy, or is the model server queueing somewhere else?
- Is memory movement becoming the bottleneck?
- Is the card throttling or throwing hardware-level errors?
- Is this node safe to keep in the serving pool?
Be careful with one metric: raw GPU utilization can lie to you.
A GPU can show high utilization while users still see poor time to first token because queueing is bad. A GPU can show moderate utilization while KV cache pressure is the real limiter. A GPU can be busy with the wrong mix of prefill and decode work. A GPU can be allocated to a pod that is not producing useful throughput.
So DCGM metrics are necessary, but they are not sufficient. You still need model-server metrics from vLLM, Triton, TensorRT-LLM, TGI, SGLang, or whatever you run. The GPU layer tells you what the hardware is doing. The serving layer tells you whether the model is serving traffic well.
Part 14 of this series will go deeper into autoscaling signals. For now, the practical point is simple: if you cannot observe GPU health and GPU memory pressure, your LLM platform is flying blind.
MIG is not the same as time-slicing
GPU sharing is one of the easiest places to confuse yourself because the words sound similar but the isolation model is different.
MIG, or Multi-Instance GPU, lets supported NVIDIA GPUs partition a physical GPU into separate GPU instances. NVIDIA describes MIG as a way to partition GPUs based on Ampere and later architectures into separate and secure GPU instances for CUDA applications. The GPU Operator can deploy MIG Manager to manage MIG configuration on Kubernetes nodes.
MIG is useful when you want stronger partitioning. A large GPU can be split into smaller slices so several workloads can run with more predictable boundaries. For smaller models, internal tools, embeddings workloads, evaluation jobs, or lower-tier inference, that can be a good use of expensive hardware.
But MIG is not magic. A MIG slice has less memory and compute than the full GPU. A model that needs a full 80 GB GPU will not fit just because the physical card is present. A workload that depends on multiple full GPUs may not be happy on fragmented MIG capacity. Changing MIG geometry can also be operationally disruptive. NVIDIA notes that MIG Manager requires no user workloads running on the GPUs being configured, and in some environments the node may need a reboot.
That matters for production planning. MIG configuration is not something you casually flip during an incident.
Time-slicing is different. NVIDIA's GPU Operator time-slicing documentation explains that time-slicing enables oversubscription by letting workloads scheduled on an oversubscribed GPU interleave with one another. Unlike MIG, time-slicing does not provide memory or fault isolation between replicas.
A cluster-wide time-slicing config looks like this:
apiVersion: v1
kind: ConfigMap
metadata:
  name: time-slicing-config
data:
  any: |-
    version: v1
    flags:
      migStrategy: none
    sharing:
      timeSlicing:
        renameByDefault: false
        failRequestsGreaterThanOne: false
        resources:
          - name: nvidia.com/gpu
            replicas: 4
Create it in the operator namespace and point the device plugin at it during install:
kubectl create -n gpu-operator -f time-slicing-config.yaml

helm install gpu-operator nvidia/gpu-operator \
  -n gpu-operator \
  --create-namespace \
  --version=v26.3.2 \
  --set devicePlugin.config.name=time-slicing-config \
  --wait
If the operator is already installed, patch the ClusterPolicy instead:
kubectl patch clusterpolicies.nvidia.com/cluster-policy \
  -n gpu-operator --type merge \
  -p '{"spec":{"devicePlugin":{"config":{"name":"time-slicing-config","default":"any"}}}}'
With replicas: 4, one physical GPU can advertise four schedulable shared replicas. Four physical GPUs can advertise sixteen. With renameByDefault: false, the resource name remains nvidia.com/gpu, while labels such as nvidia.com/gpu.product can get a -SHARED suffix and nvidia.com/gpu.replicas=4 tells you the oversubscription factor.
kubectl describe node <gpu-node-name> | grep -A8 -E "Labels:|Capacity:|Allocatable:"
Example shape for one physical GPU with four time-sliced replicas:
Labels:
  nvidia.com/gpu.count=1
  nvidia.com/gpu.product=Tesla-T4-SHARED
  nvidia.com/gpu.replicas=4

Capacity:
  nvidia.com/gpu: 4

Allocatable:
  nvidia.com/gpu: 4
That tradeoff is huge.
Time-slicing can be useful for lightweight workloads, experiments, notebooks, CI jobs, embeddings, small internal tools, dev/test endpoints, or low-duty-cycle inference where exclusive GPU access would waste money. If every tiny workload asks for a full nvidia.com/gpu: 1 and gets exclusive access, one notebook or one small model can occupy the entire scheduling unit while using only a fraction of the card.
Time-slicing helps utilization by allowing more pods to share the same physical GPU over time. The value is sharing, not isolation.
A pod that requests a time-sliced GPU is not getting a private piece of hardware. It is getting shared access to an underlying GPU. It does not get separate GPU memory. It does not get fault isolation. It does not get guaranteed proportional compute. NVIDIA explicitly notes that requesting more than one time-sliced GPU does not guarantee a proportional amount of GPU compute power.
So do not treat replicas: 4 as four real GPUs. Use time-slicing for workloads that can tolerate noisy neighbors. Be very careful with latency-sensitive LLM serving, large models near memory limits, or coordinated multi-GPU serving groups.
MPS, the NVIDIA Multi-Process Service, is another sharing mechanism. It can improve GPU utilization for multiple CUDA processes by letting them share execution resources more efficiently, but it also needs careful workload-level testing. For LLM serving, the question is not "can we share this GPU?" The question is "can we share this GPU without destroying latency, memory predictability, or failure isolation?"
Those are different questions.
GPU memory is a scheduling constraint, even when Kubernetes does not see it that way
This is one of the biggest gaps between LLM reality and default Kubernetes scheduling.
Kubernetes can schedule nvidia.com/gpu: 1. But a single GPU is not a uniform unit. The useful capacity depends heavily on GPU memory.
A 7B model in FP16 or BF16 may fit on many cards. A 70B model may need much more memory, especially after you include KV cache and runtime overhead. A long-context workload can run out of memory even if the model weights fit. A workload with high concurrency can hit KV cache pressure long before the GPU looks simple to the scheduler.
Kubernetes does not natively schedule based on "80 GB of GPU memory free for this pod" in the same way it handles CPU and RAM requests. You need to model this through one or more of:
- separate node pools by GPU memory class
- labels for GPU product and memory size
- admission policy that maps workload profiles to allowed GPU classes
- MIG profiles when slicing is appropriate
- model-server-level controls for max context, max batch size, and max concurrent sequences
- observability that catches GPU memory pressure before users do
This is why Part 3's memory math matters even after you leave the article. Weight memory math tells you what class of node the model can run on. GPU node setup tells Kubernetes how to find that class of node.
If you skip this step, you get weird failures: pods schedule successfully, containers start, the model begins loading, then dies with CUDA out-of-memory errors. Kubernetes did its job. You gave it the wrong abstraction.
The container runtime is part of the serving path
Another easy mistake: treating the container image as if it is enough.
For a GPU workload to work inside a container, the host and runtime must expose the GPU correctly. The NVIDIA Container Toolkit is part of that path. The driver has to exist on the host or be managed through the operator. The container needs compatible userspace libraries. The kubelet and runtime need to know how to make GPU devices available to the container.
This is why GPU node readiness is more than kubectl get nodes showing Ready.
A node can be Ready for normal pods and still be broken for GPU workloads. The failure may only appear when a pod tries to start, load CUDA, initialize NCCL, or run the model server. Good GPU platforms usually add validation pods or smoke tests that check the GPU path before developers depend on the node.
A simple mental checklist:
- Can the node see the GPU?
- Is the driver loaded?
- Can a container see the GPU?
- Does a CUDA sample work?
- Does the device plugin advertise the resource?
- Do labels describe the GPU accurately?
- Does DCGM report metrics?
- Can the intended model server initialize on this node?
- Can a small test model load and serve a request?
If the answer stops at "the node is Ready," you have not tested enough.
Multi-GPU nodes need topology awareness
Part 3 talked about tensor parallelism and pipeline parallelism. This is where that discussion touches the node.
If a model server needs multiple GPUs, placement inside a node matters. GPUs may be connected differently. Some paths have better bandwidth. Some nodes have NVLink. Some rely more heavily on PCIe. The serving engine may assume a certain number of GPUs per worker. NCCL performance may depend on the topology.
Kubernetes, by default, is not deeply reasoning about your tensor parallel group. If a pod requests four GPUs on a node, the device plugin can allocate devices, but the model server still has to use them correctly. If a deployment needs multiple pods across nodes, Kubernetes can place those pods, but the serving framework has to coordinate the ranks.
This article is not the dedicated scheduler article. That comes later. But the GPU node setup matters here because scheduling cannot become topology-aware if the platform does not expose useful topology and node information in the first place.
A practical rule: keep the first successful design boring.
If a model can run with tensor parallelism inside one node, start there before spreading a single serving replica across nodes. Multi-node serving adds network sensitivity, failure coordination, startup sequencing, and debugging pain. Kubernetes can manage the shape, but it will not make a bad topology fast.
What a practical GPU node baseline looks like
A serious LLM GPU node baseline does not have to be fancy. It needs to be explicit.
At a minimum, I would want a platform team to know the answers to these questions before onboarding production LLM workloads:
Who owns driver installation and upgrades?
The GPU Operator can manage drivers, or the node image pipeline can manage them. Both can work. The bad answer is "we are not sure."
How are GPUs advertised to Kubernetes?
The NVIDIA device plugin should expose GPU resources consistently. You should know what resource names workloads request, especially if MIG or time-slicing is enabled.
How are GPU nodes labeled?
Node labels should capture GPU class, node pool purpose, MIG strategy if relevant, and anything else needed for scheduling decisions.
How are GPU nodes isolated?
Use taints, tolerations, node pools, quotas, and policy so random workloads do not land on expensive GPU nodes.
How are GPU metrics collected?
DCGM Exporter should feed your observability stack. Model-server metrics should sit beside GPU metrics so you can connect hardware behavior to LLM behavior.
What sharing mode is allowed?
Full GPU, MIG, time-slicing, and MPS are different operational choices. Do not let teams discover the difference after latency falls apart.
How do you validate a node before using it?
Have a smoke test for CUDA, device plugin resources, labels, DCGM metrics, and a small model-server startup path.
Which workloads are allowed on which GPU classes?
A small embedding service, an internal chatbot, a batch summarization job, and a large production model should not all be scheduled with the same policy.
Turn that baseline into a small verification routine:
kubectl get pods -n gpu-operator
kubectl describe node <gpu-node-name>
kubectl apply -f cuda-vectoradd.yaml
kubectl logs pod/cuda-vectoradd
kubectl get svc -n gpu-operator | grep -i dcgm
By the end of this check, you should know whether the node is Ready, the operator components are running, the device plugin advertises GPU resources, the node has useful GPU labels, GPU workloads can start, DCGM metrics are available, and your sharing mode is explicit.
This baseline is boring on purpose. Most production incidents are not caused by exotic scheduler theory. They are caused by a missing label, a wrong driver, an unisolated node pool, a bad sharing assumption, or a metric nobody collected.
The pod starts late in the story
By the time an LLM pod starts, many decisions have already been made.
The node pool decided what hardware exists. The driver stack decided whether CUDA works. The device plugin decided what resources Kubernetes can allocate. Feature discovery decided what labels describe the node. Taints and tolerations decided who is allowed to land there. MIG, MPS, or time-slicing decided what "a GPU" means on that node. DCGM decided what you can observe. The model server will decide how efficiently the allocated GPU is used.
The pod is where all of those decisions meet.
That is why GPU node setup deserves its own article. It is not glamorous, and it is not the full LLM platform. But if this layer is wrong, everything above it becomes harder: vLLM, Triton, TensorRT-LLM, KServe, Ray, autoscaling, routing, cost control, latency tuning, and multi-tenancy.
Kubernetes can schedule LLM workloads only as well as the cluster describes its GPU capacity.
So before you ask why your LLM pod is slow, unstable, expensive, or impossible to place, ask a simpler question:
What did the GPU node actually tell Kubernetes before the pod started?
Continue the series
This is Part 4 of my practical series on hosting large LLMs on Kubernetes. The next parts will move from GPU node setup into real-world scaling stories, model servers, KV cache, batching, scheduling, autoscaling, latency, cost, and production architecture.
I am also preparing a free LLM Serving on Kubernetes Production Readiness Checklist with the questions platform teams should ask before putting an LLM workload in production. Subscribe to the newsletter and I will share it when it is ready.
Enjoyed this post?
Get AI + DevOps insights delivered to your inbox. No spam, unsubscribe anytime.